Actividad: D3 + Google Spreadsheet Volver
Gráfico scatterplot
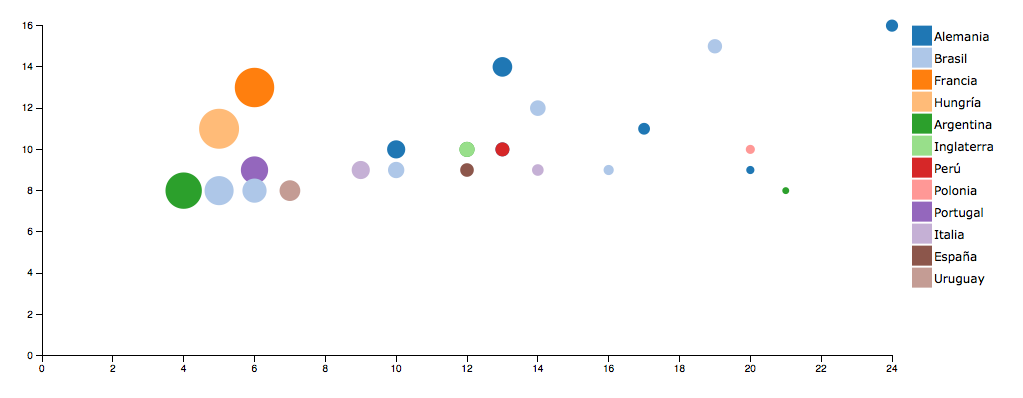
Actividad D3: Dada la información de los goleadores de los mundiales en un Google Spreadsheet crear un gráfico scatterplot usando d3.js y CSS.
La data
Como podemos ver en este archivo, la data está en un archivo de Google Spreadsheet. Esto nos da la flexibilidad para poder actualizar la data de nuestra visualización de forma muy fácil en el futuro.
Usaremos la librería TABLETOP para cargar la data desde el spreadsheet a nuestro archivo.
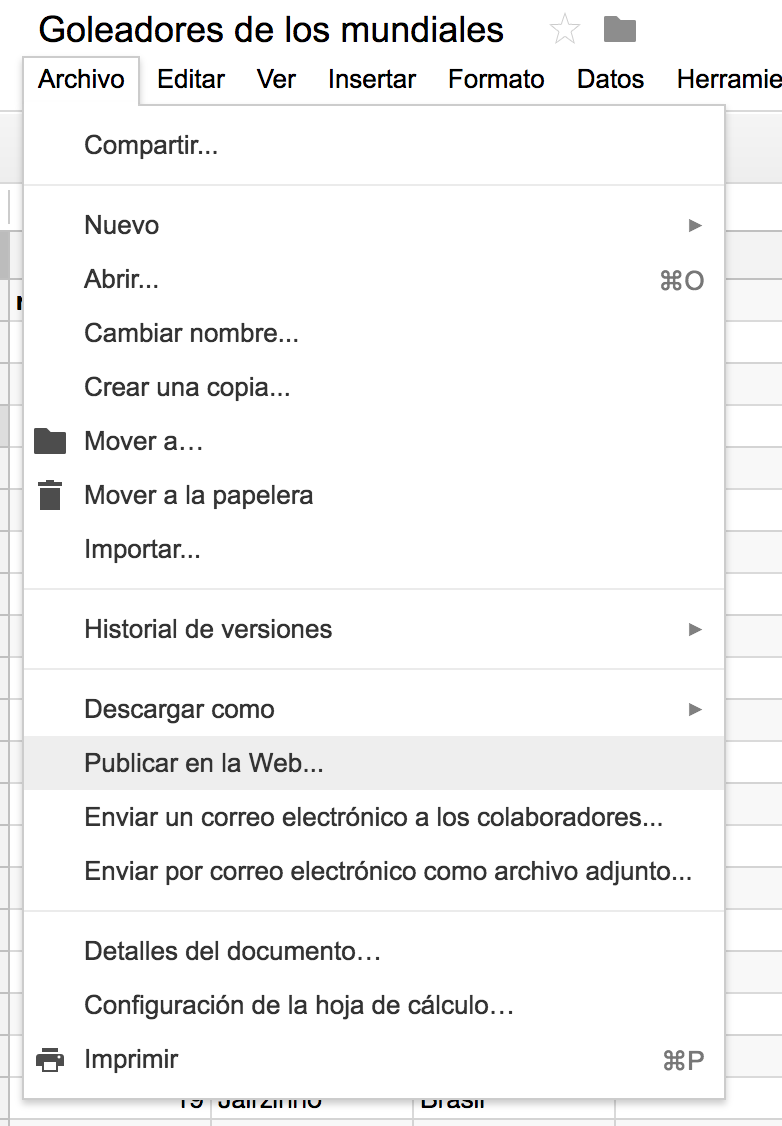
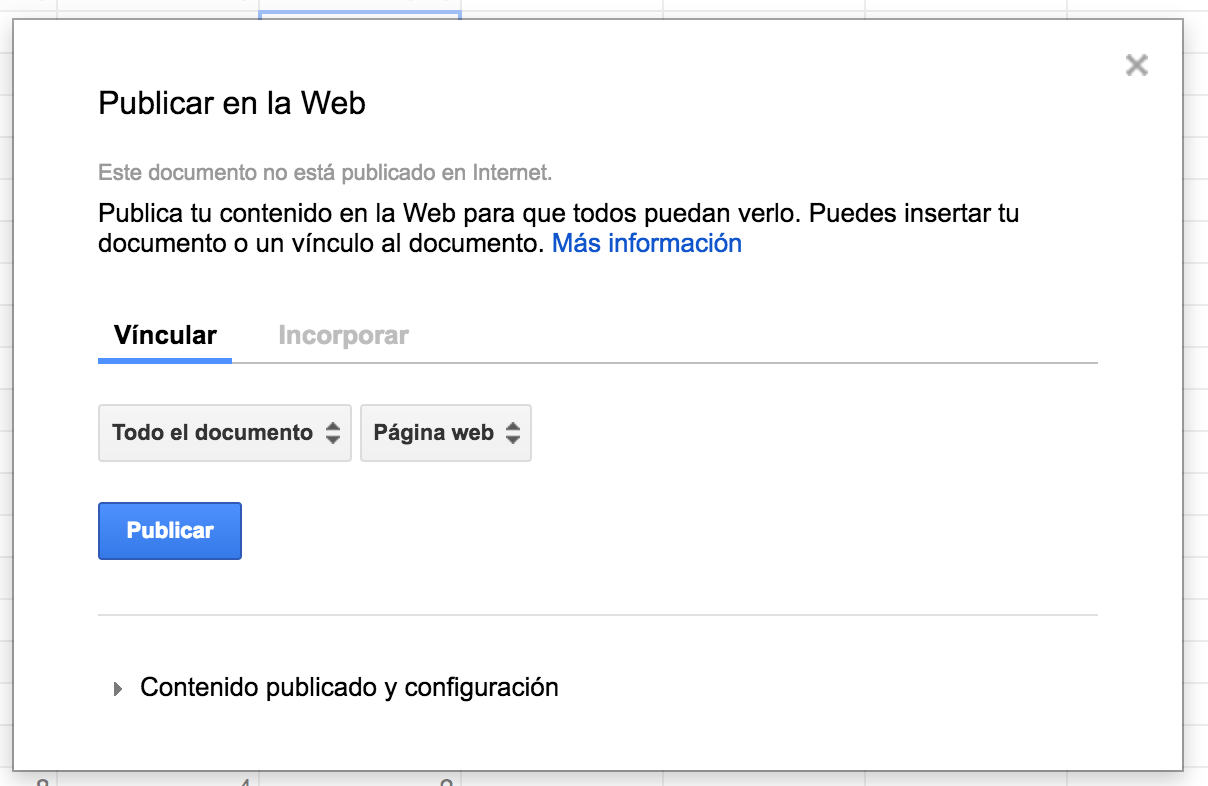
Para acceder a la data, el spreadsheet debe estar publicado para la web:
Template para empezar a trabajar Ver template
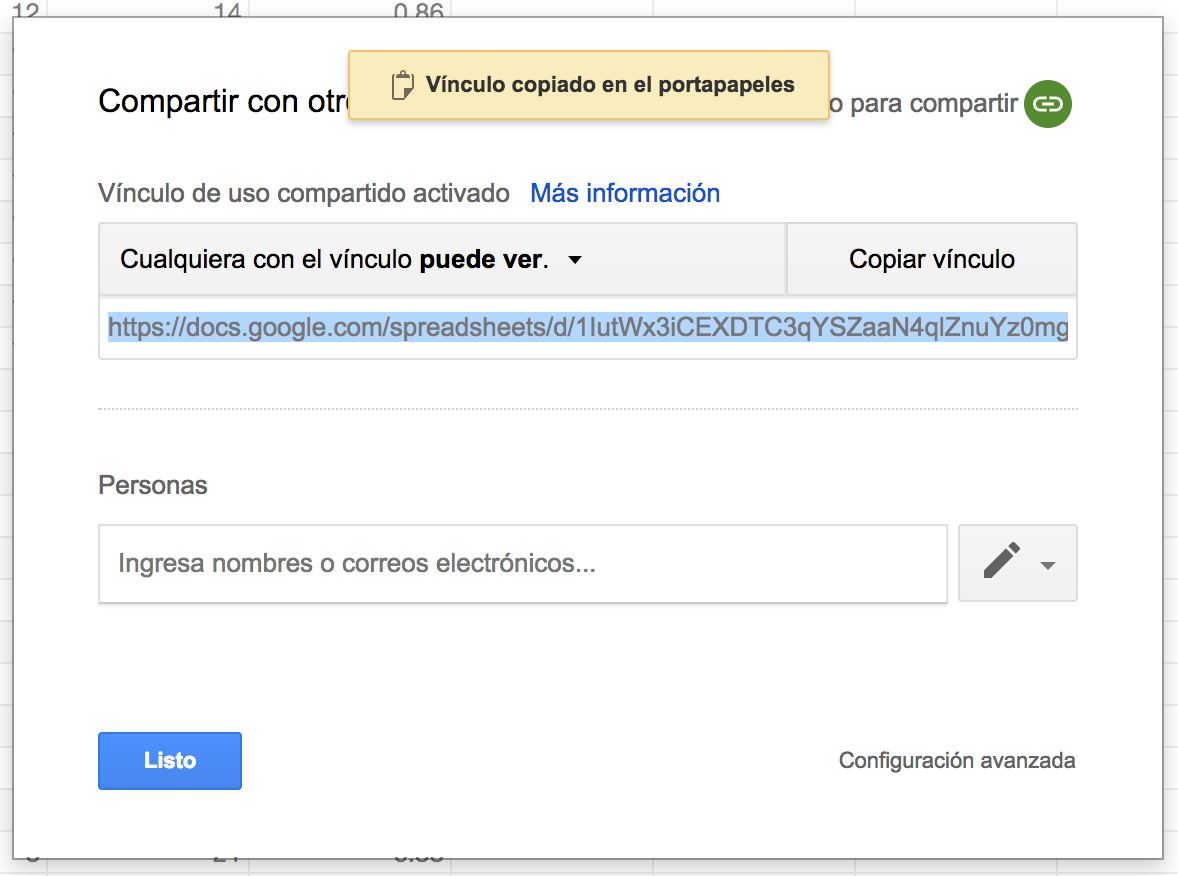
//Aquí va la dirección del spreadsheet
var url = 'https://docs.google.com/spreadsheets/d/1IutWx3iCEXDTC3qYSZaaN4qlZnuYz0mg1tbDtFa-RqU/edit?usp=sharing';

//Función de tabletop para traer la data
Tabletop.init( { key: url,
                 callback: dibujar,
                 simpleSheet: true,
                 parseNumbers:true } );

//Función propia que recibe la data cuando ya está cargada y podemos dibujar nuestra viz
function dibujar(data){
  //Imprime data
  console.log(data);
}
SVG
Definimos variables con tamaños y creamos el SVG
// Tamaños
var margin = {top: 20, right: 20, bottom: 150, left: 40},
    width = 960 - margin.left - margin.right,
    height = 500 - margin.top - margin.bottom;

// Crear SVG
var svg = d3.select("#chart").append("svg")
    .attr("width", width + margin.left + margin.right)
    .attr("height", height + margin.top + margin.bottom)
    .append("g")
    .attr("transform", "translate(" + margin.left + "," + margin.top + ")");
Máximos
Calcular el máximo de cada variable a utilizar.
//Máximos
var golesMax = d3.max(data,function(d){
      return d.goles;
    });
var partidosMax = d3.max(data,function(d){
    return d.partidos;
  });
Escalas
Setear las escalas para cada eje.
//Escalas
var x = d3.scale.linear()
  .domain([0,partidosMax])
    .range([0, width]);

var y = d3.scale.linear()
  .domain([0,golesMax])
    .range([height, 0]);
Ejes
Crear los ejes con las escalas y agregarlos al svg.
//Ejes
var xAxis = d3.svg.axis()
  .scale(x)
  .orient("bottom");

var yAxis = d3.svg.axis()
  .scale(y)
  .orient("left");

svg.append("g")
  .attr("class", "x axis")
  .attr("transform", "translate(0," + height + ")")
  .call(xAxis)

svg.append("g")
  .attr("class", "y axis")
  .call(yAxis);
Círculos
Creamos los círculos y los ubicamos de acuerdo a las escalas
//Círculos
svg.selectAll(".circulos")
  .data(data)
  .enter()
  .append("circle")
  .attr("class", "circulos")
  .attr("cx", function(d) { return x(d.partidos); })
  .attr("cy", function(d) { return y(d.goles); })
  .attr("r", function(d) { return 20 });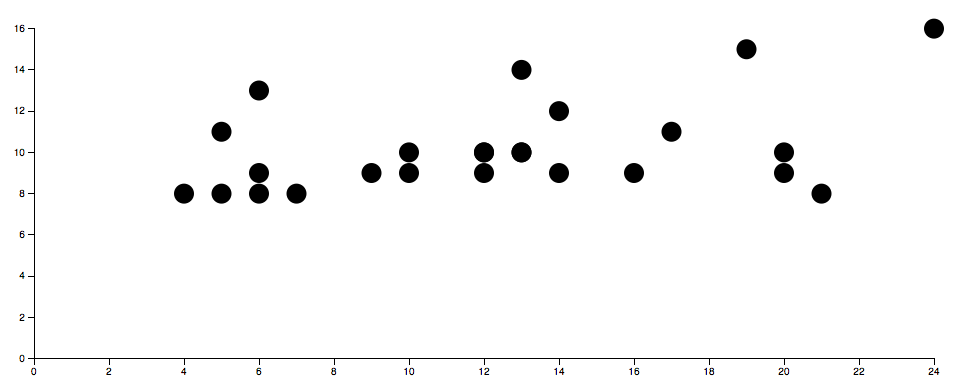
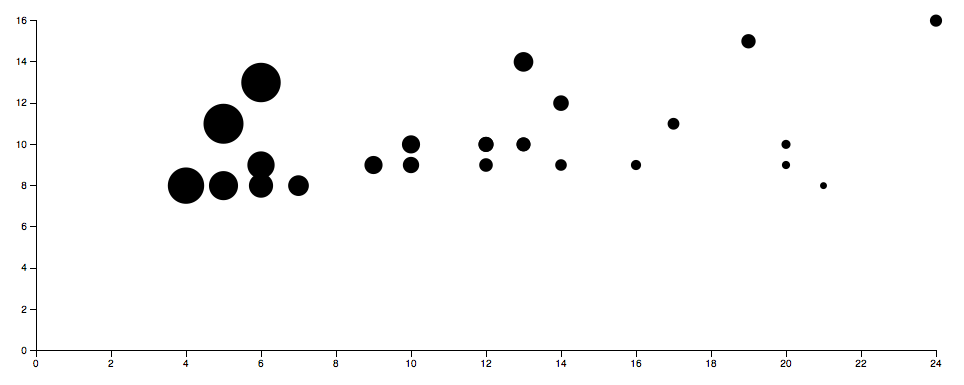
Escala para el radio
Calculamos máximo, creamos escala y aplicamos radio.
//Promedio máximo
var promedioMax = d3.max(data,function(d){
  return d.promedio;
});

//Escala para radio
var radio = d3.scale.linear()
  .domain([0,promedioMax])
  .range([0, 20]);

//Modifico el radio del círculo para que utilice la escala
//...
.attr("r", function(d) { return radio(d.promedio); });
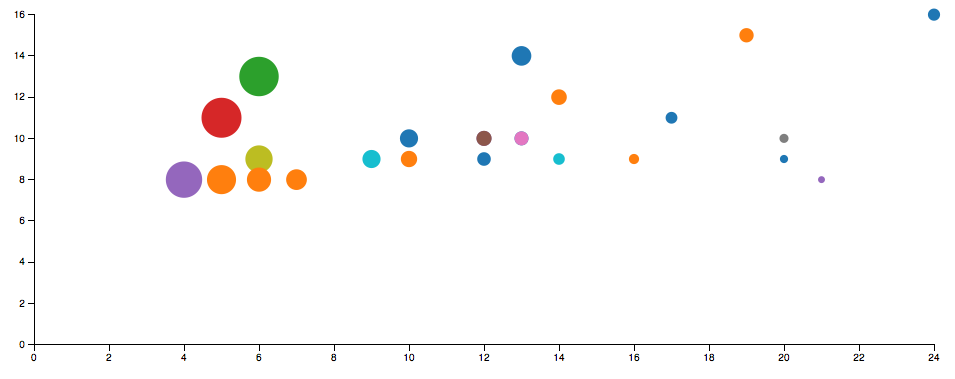
Escala para el colores
Calculamos máximo, creamos escala y aplicamos radio.
//Creo la escala de colores
var color = d3.scale.category20();

//Agrego el color al círculo usando la escala basado en el equipo
//...
.style("fill", function(d) { return color(d.equipo);})
Legenda
Creamos la leyenda con el cuadrado y el nombre.
//Legend
var legend = svg.selectAll(".legend")
  .data(color.domain())
  .enter().append("g")
  .attr("class", "legend")
  .attr("transform", function(d, i) { return "translate("+(width+20)+"," + i * 22 + ")"; });

// draw legend colored rectangles
legend.append("rect")
  .attr("x", 0)
  .attr("width", 20)
  .attr("height", 20)
  .style("fill", color);

// draw legend text
legend.append("text")
  .attr("x", 22)
  .attr("y", 15)
  .text(function(d) { return d;})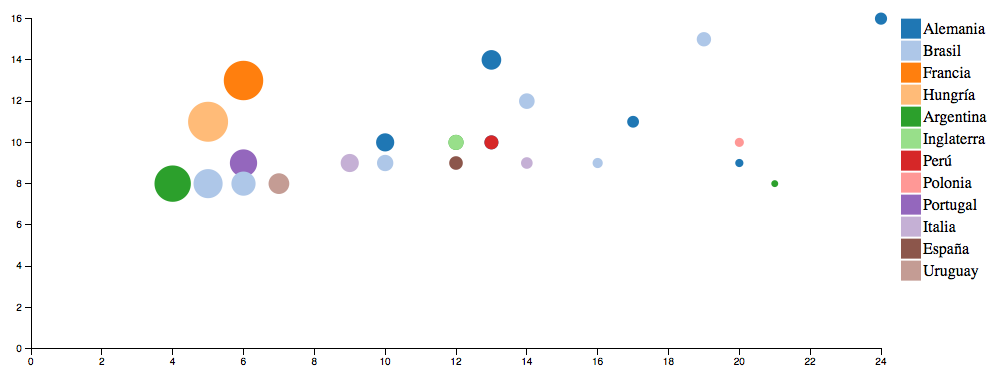
Agregamos acciones del mouse
Eventos sobre los círculos
.on("mouseenter", function(d){
  console.log('entra',d);
})
.on("mouseout", function(d){
  console.log('sale');
});
Creamos el círculo de selección animado
Un nuevo círculo, suelto en el svg que lo moveremos cuando sea pasemos por otro círculo.
//Círculo de selección
var seleccion = svg.append('circle')
  .attr("class", "seleccion")
  .attr('cx',0)
  .attr('cy',0)
  .attr('r',10)
  .style('fill','none')
  .style('stroke','black')
  .style('stroke-width',2);
Cambiamos ubicación, color y radio del círculo al hacer contacto con el mouse.
seleccion
        .attr('cx',x(d.partidos))
        .attr('cy',y(d.goles))
        .attr('r',radio(d.promedio)+4)
        .style('stroke',color(d.equipo));
Hacemos que aparezca apagado y se prenda cuando lo necestamos y se vuelva a apagar.
//invisible
.style('opacity',0);

//visible
.style('opacity',1);
Usamos transition para agrandarlo al momento del mouseenter y achicharlo en el mouseout
.on("mouseenter", function(d){
  seleccion
    .attr('cx',x(d.partidos))
    .attr('cy',y(d.goles))
    .attr('r',0)
    .style('stroke',color(d.equipo))
    .transition()
    .duration(500)
    .attr('r',radio(d.promedio)+4)
    .style('opacity',1);
})
.on("mouseout", function(d){
  seleccion
    .transition()
    .duration(200)
    .attr('r',0)
    .style('opacity',0);
});
Tooltip
Mostramos el nombre del jugador, cuando estemos por encima del círculo.
var seleccionTexto = svg.append('text')
    .attr("class", "seleccionTexto")
    .attr('x',0)
    .attr('y',0)
    .attr('text-anchor',"middle")
    .text('ejemplo de texto');
Creamos un texto suelto
En el mousenter lo ubicamos y le ponemos el texto del nombre.
Agregar estilo y color a gusto. :D
seleccionTexto
            .attr('x',x(d.partidos))
            .attr('y',y(d.goles)-radio(d.promedio)-5)
            .text(d.nombre);
Líneas
Sin más ayuda que la documentación, crear estas líneas que ayudan a identificar el valor en el eje.
Solución
¿Quedó algo parecido a Ver solución ?